The Research Process of Hodl (2/2)
- The Basics of Techincal Analysis
- Support & Resistance
- Trendlines
- How does Hodl implement TA?
- Execution
- Conclusion
Last month, we published a blog about the research process of the Hodl Funds. As there are thousands of cryptocurrencies, the investment possibilities are endless, however, finding the correct ones can be a difficult task. To optimize our time researching these projects, the research analysts created a framework to identify the best investment opportunities. This framework consists of the:
Due Diligence Stage
Quickscan Stage
Research Stage
Discussion Stage
When the project has passed all four stages and the team of research analysts concludes that the project is worth investing in, the team will discuss the size of the allocation and how to scale into a position. You can read more about the fundamental research process of the Hodl Funds in our previous blog through the button below.
Our research analysts enter positions through the use of technical analysis (TA), a method used in trading which enables traders to identify trading opportunities based on indicators, trading volume and price action. For many, this topic is a dive into the deep as there are many indicators, data points and it still requires a technical eye. However, with this comprehensive overview, we hope to give you an indication of the inner workings of the Hodl Funds and how our research analysts utilize TA.
The Basics of Techincal Analysis
In simple terms, TA is studying the chart of an asset, security or cryptocurrency to determine potential trends or trading opportunities. A chart consists of three core elements:
The price of the asset on the y-axis
The date/time period on the x-axis
The candlesticks that indicate the price levels
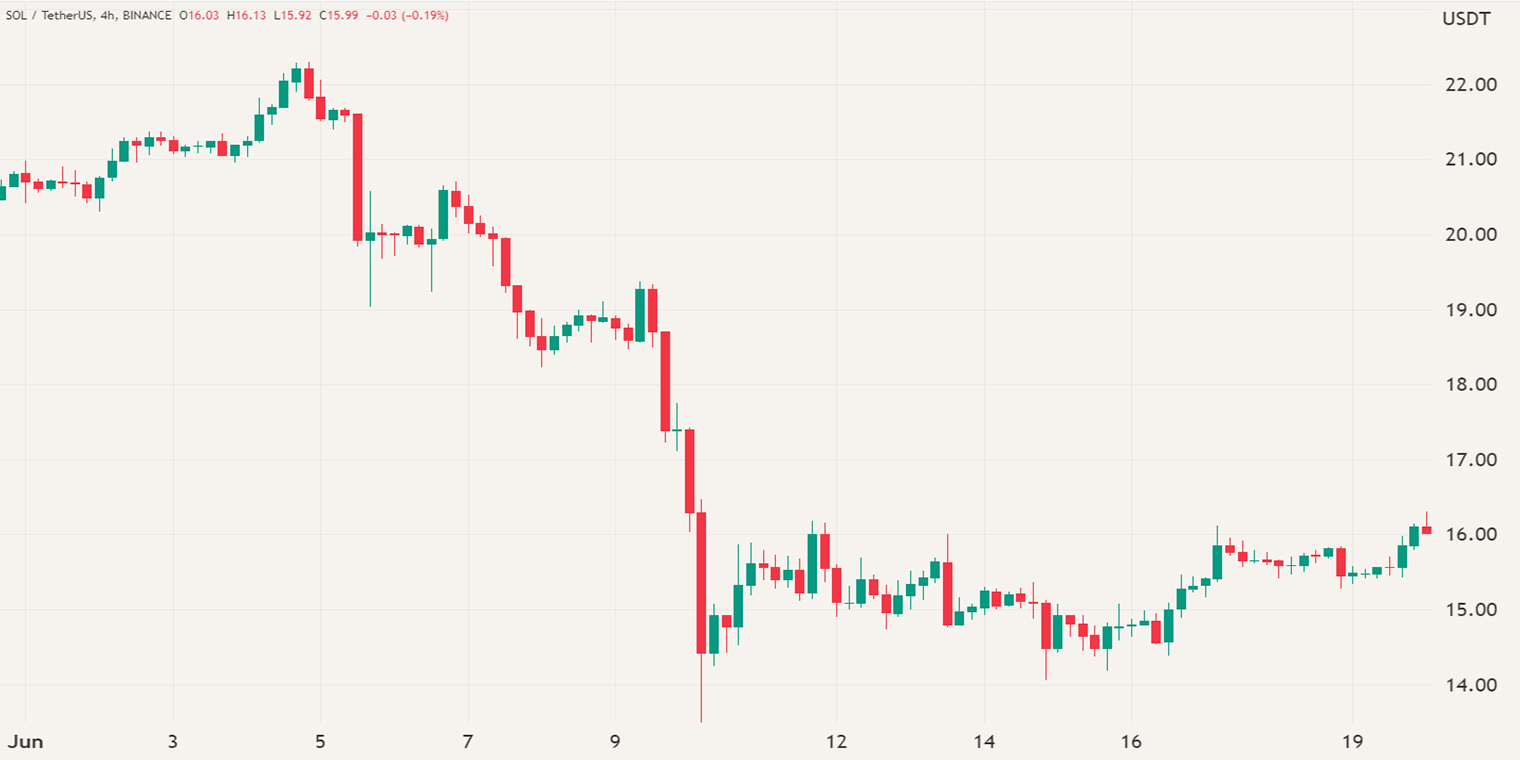
This is considered a plain chart, from here, the trader can adjust the price range (y-axis), time frame (x-axis) and the time displayed by the candlesticks. This is one of the first things people find difficult to understand. A single candlestick represents a certain time frame such as 1 second, 1 minute or even a year. Within this timeframe, the candlestick will form a unique shape that illustrates the price action of that period. In the illustration below, it’s explained how you can read a candlestick.
A candlestick consists of four elements: the highest price and lowest price at the extremities, opening price and closing price in between. When analyzing a certain timeframe, price oscillations can be seen. After a drop, or an upward spike, a so-called shadow will form between the opening and lowest price. This shadow is also often referred to as ‘Wick’. The range between the opening and closing price marks the body of the candlestick. At the end of the set timeframe of that candlestick, a new candlestick will open with the closing price of the previous candle.
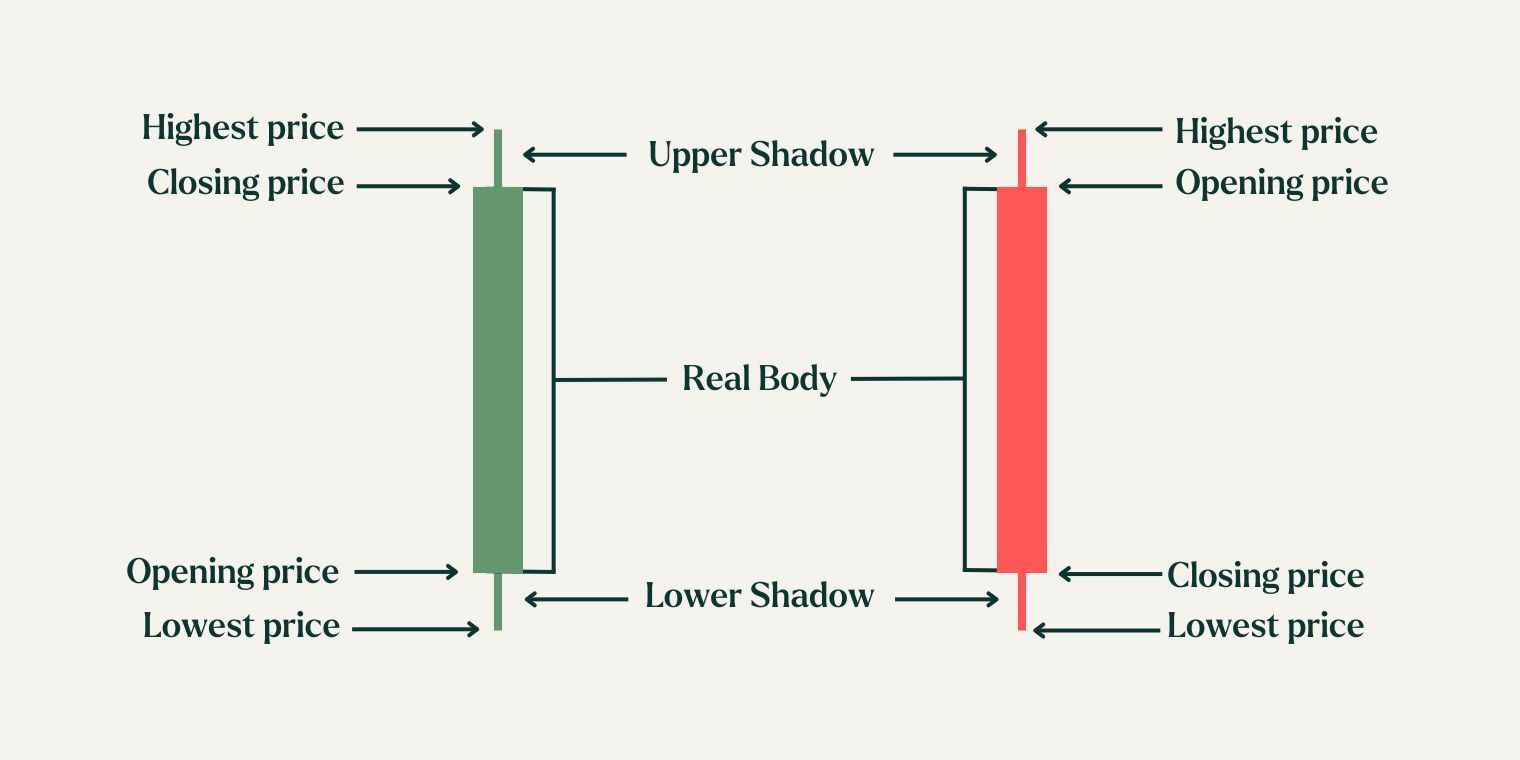
The candlestick will turn green when the closing price is higher than the opening price, indicating that the price is increasing or has increased. The candlestick will turn red when the closing price is lower than the opening price, indicating that the price is decreasing or has decreased.
After adjusting the axis and candlesticks, the trader will search for short and long-term trends, which can also be used with trend lines.
Support & Resistance
Support and resistance levels are crucial aspects of market analysis. Understanding their fundamental basis is essential before delving into the intricacies of market movements. These levels represent psychological price zones where support acts as a point where the market typically bounces upward, while resistance hinders further price advancement. Various factors contribute to the formation of these levels.
They often materialize at round numbers, as traders subconsciously tend to take profits when prices reach whole figures. For instance, it is more likely for traders to exit a position at €1.500 rather than €1.502 due to the psychological appeal of round numbers. Additionally, these levels form at previous highs and lows, marking critical turning points as the price enters relatively uncharted territory.
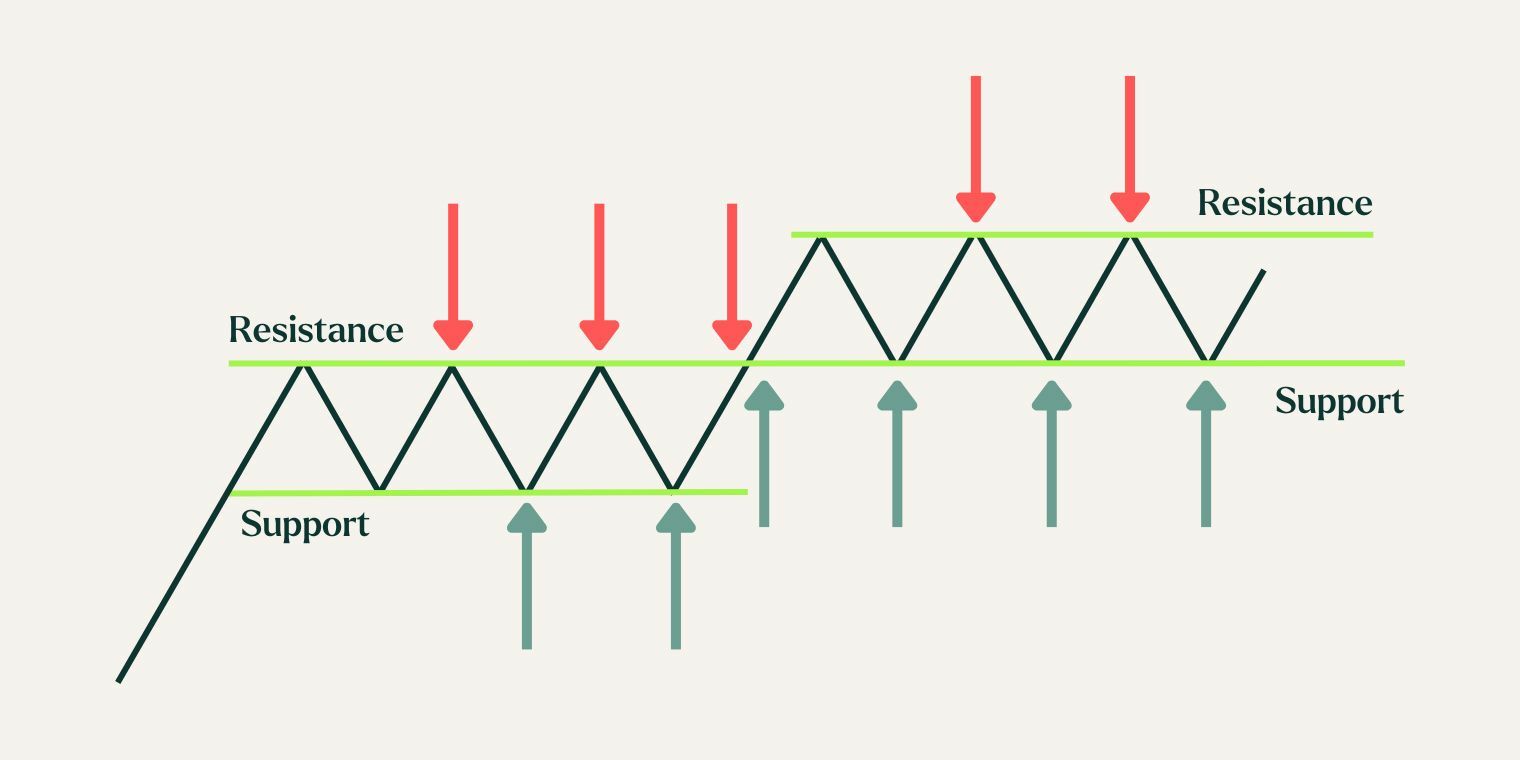
Once the trend is rejected and a correction is initiated, traders will then try to find a support level. The price may fluctuate for a while between levels of support and resistance until one is broken. When the resistance level is broken, the price will continue to increase until it finds an older resistance level or when price action forms a new resistance level. The old resistance level will then become a support level. This can also be the other way around, if a support level is broken it can turn into a resistance level. Other than determining the trend of a market, these support and resistance levels are an important piece of the puzzle when it comes to the timing of buying and selling assets for the Hodl funds.
Trendlines
When the trader has adjusted his chart to the desired timeframe, it’s possible to determine an upward or downward trend. The trader can then draw a trend line on the chart to establish the overall direction and trajectory of the asset. A trend line can be drawn as a support and resistance line as seen in the illustration below.
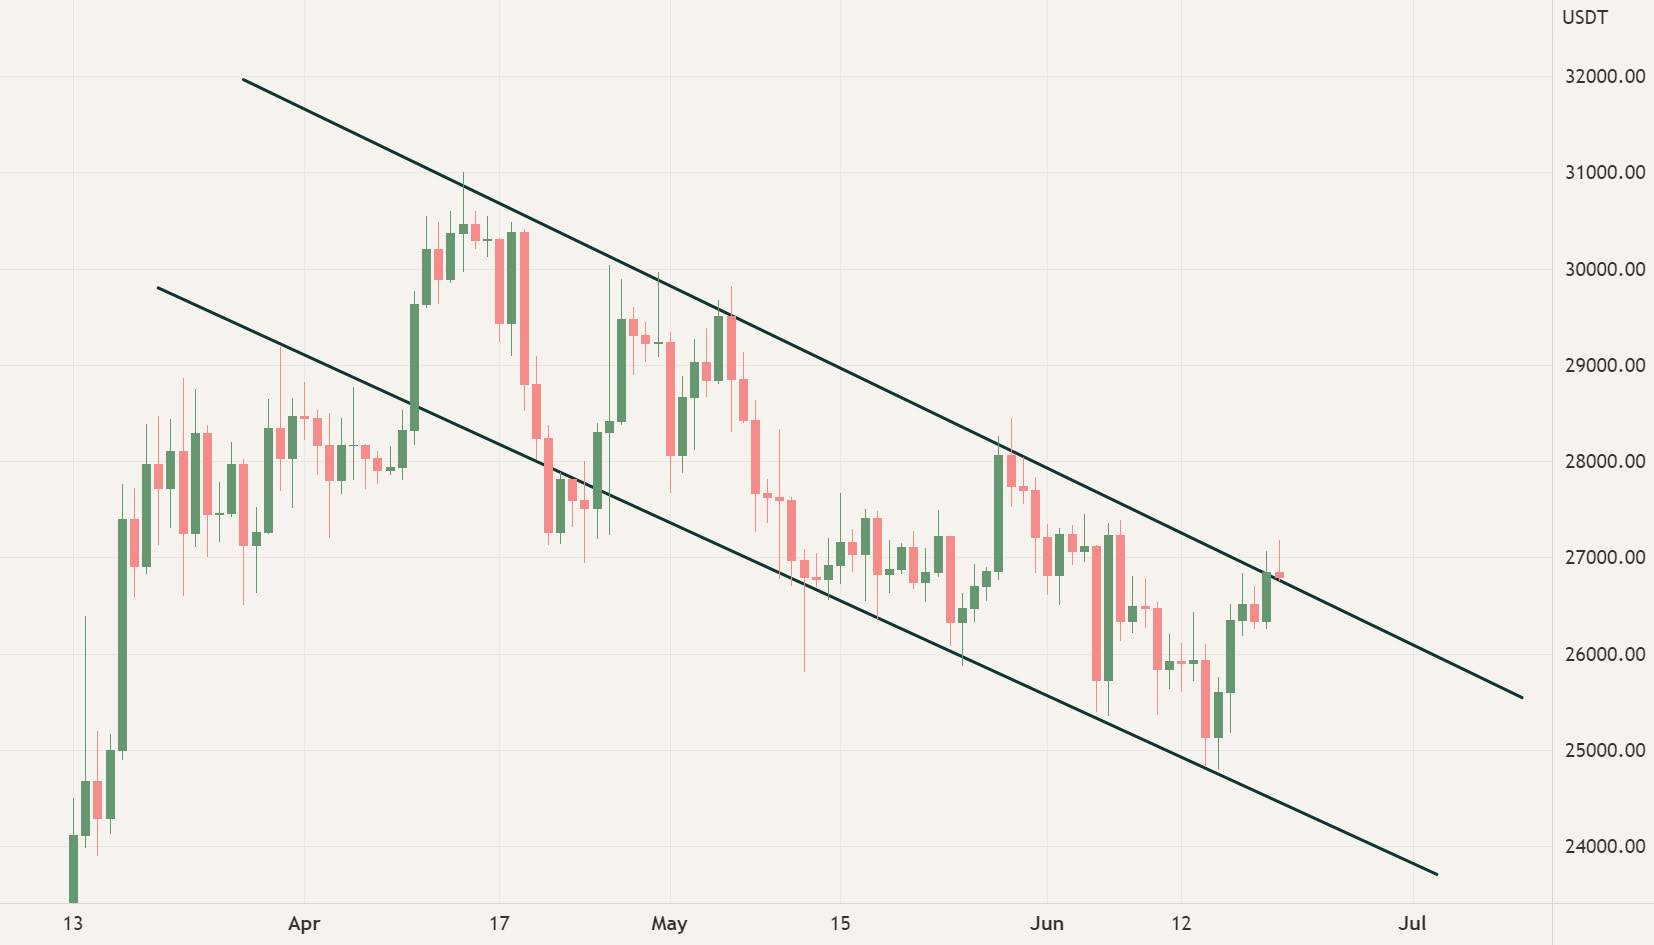
When the price moves between two lines and continues to make higher highs and higher lows, it is referred to as having an upward trend. The price will then tend to move between these two lines until the trend is broken by either a downward correction which drives the price below the support trend line or a strong upward move which breaks the resistance. These lines can operate as buying and selling levels for the asset and are crucial for the development of buying and selling plans.
How does Hodl implement TA?
Hodl implements TA mainly for establishing its trade plans which includes buying and selling levels for each of the fund's holdings, each trader has his own trading pairs to monitor and also send updates about. When the research analysts decide to invest in a cryptocurrency, it would be unwise to enter the position with the full allocation without looking at the chart.
First, the analysts will develop a buying plan. This buying plan consists of major support levels at which the asset can be acquired at favorable prices, if the asset is in an upwards trend, the buying plan can also consist of resistance levels. The asset won’t be acquired the moment the price reaches this level, but after confirmation on the daily chart, indicating that the resistance has converted into a support level, the asset will be acquired.
The analysts will also establish a sell plan, this plan consists of key resistance levels where profit can be taken for new potential investments. However, in extreme cases, the buying and selling plans may change as TA doesn’t take macroeconomic conditions and several other factors into account.
After establishing both plans, our research analysts will keep monitoring the charts, news, upgrades, voting-rounds and other important events within the assets’ ecosystem. It’s important to note, our research analysts don’t look at U.S. dollar denominated charts but at BTC denominated charts.
With our long-only funds, we wish to maintain a cryptocurrency exposure and be less in stablecoins. To achieve this, the fund's holdings are always traded against BTC. Thus, if we wish to scale out, for example Ethereum, the ETH is converted into BTC while looking at the ETH/BTC chart. Through this implementation, we are able to gain more coins/tokens and effectively amass our holdings.
A drawback of this strategy is that the Hodl Funds miss out potential buying power during a sharp downwards move. The possibility of acquiring BTC at lower price levels, lowers the average entry price of the funds and the amount of volatility. Currently, Hodl is creating a Stablecoin strategy which will support the funds during these periods.
We are looking at metrics such as Price, Time, Volatility, and Diminishing returns, to determine the risk in the market. Based on the risk, we start selling in a DCA manner. And as an extra check, we also use various trend indicators to confirm when the trend is changing. When these signals are triggered, the holdings of the Hodl Funds will undergo a Dollar Cost Averaging selling plan. During this phase, the ratios of the coins in our portfolio will also be rebalanced. This helps to optimize our risk-reward ratios during a downward period. The stablecoins acquired will be divided among a basket of different stablecoins to minimize risk and are reserved for the next investment opportunity.
Execution
When the buying/selling levels of a specific asset are triggered, the team of analysts will receive a message in a central messaging system. The analysts will then retrieve the plan and discuss if the current level is still desirable to buy or sell. For example, if the asset is displaying a strong downwards movement and it seems that the support level will be broken, scaling into a position won’t be optimal. The analysts will then wait until the level is confirmed on the daily chart. When it is confirmed that the level won’t be broken, we will enter/leave the position. In essence, a trading execution is a unanimous decision.
Conclusion
The research process of Hodl is divided into two phases: the fundamental analysis and the technical analysis. The process starts with the fundamental analysis in which we separate the wheat from the chaff by setting minimum requirements. When the requirements are met, we start by researching the various aspects of the asset such as the team behind it. After researching the fundamental elements we compare the project to competitors in the same industry/sector. Based on the findings, the analysts need to convince the entire team of its potential.
If the team is convinced, the project will move into the technical analysis phase. In this phase, the team will develop a strategy based on the current price and trends in the market. The strategy will include both a buying and a selling plan of the asset in order to assure optimal performance and exclude emotional involvement. Sticking to this execution is key to realize the best result.